procwatch — Linux Process Monitor Daemon
A C++17 Linux process monitor daemon that scrapes /proc directly, streams live process telemetry over TCP as newline-delimited JSON, and renders it in an ncurses client — built with no dependencies beyond pthreads and ncurses.
Technology Stack
Overview
procwatch is a Linux process monitor written from scratch in C++17 to understand how tools like top and htop actually get their numbers.
Instead of shelling out to system utilities, the daemon reads the kernel's /proc filesystem directly, derives CPU usage from tick deltas, and streams complete snapshots to any number of connected clients over a plain TCP socket. A separate ncurses client consumes that stream and renders a live, sortable process table.
The project uses no external libraries — no JSON parser, no networking framework, no popen or system() calls. Everything from the wire format to the fan-out broker is hand-written against POSIX APIs.
Core Features
- •Direct
/procscraping ofstat,status, andfd/for PID, name, state, CPU%, RSS, thread count, and open file descriptors. - •Delta-based CPU accounting using
utime/stimeticks, monotonic wall time, and_SC_CLK_TCK. - •Thread-safe process store keeping the latest snapshot per PID behind a
pthread_rwlock_t. - •Alert engine with configurable CPU and memory thresholds, requiring three consecutive high-CPU ticks before firing to suppress transient spikes.
- •Fan-out broker serializing snapshot batches and alerts as newline-delimited JSON, with hand-rolled JSON escaping.
- •TCP streaming server on a configurable port with non-blocking sends, dead-connection reaping, and
SIGPIPEignored at the daemon level. - •ncurses TUI client with CPU-based row coloring, live sorting by CPU / memory / PID, reverse ordering, recent alerts, host info, and uptime.
System Architecture
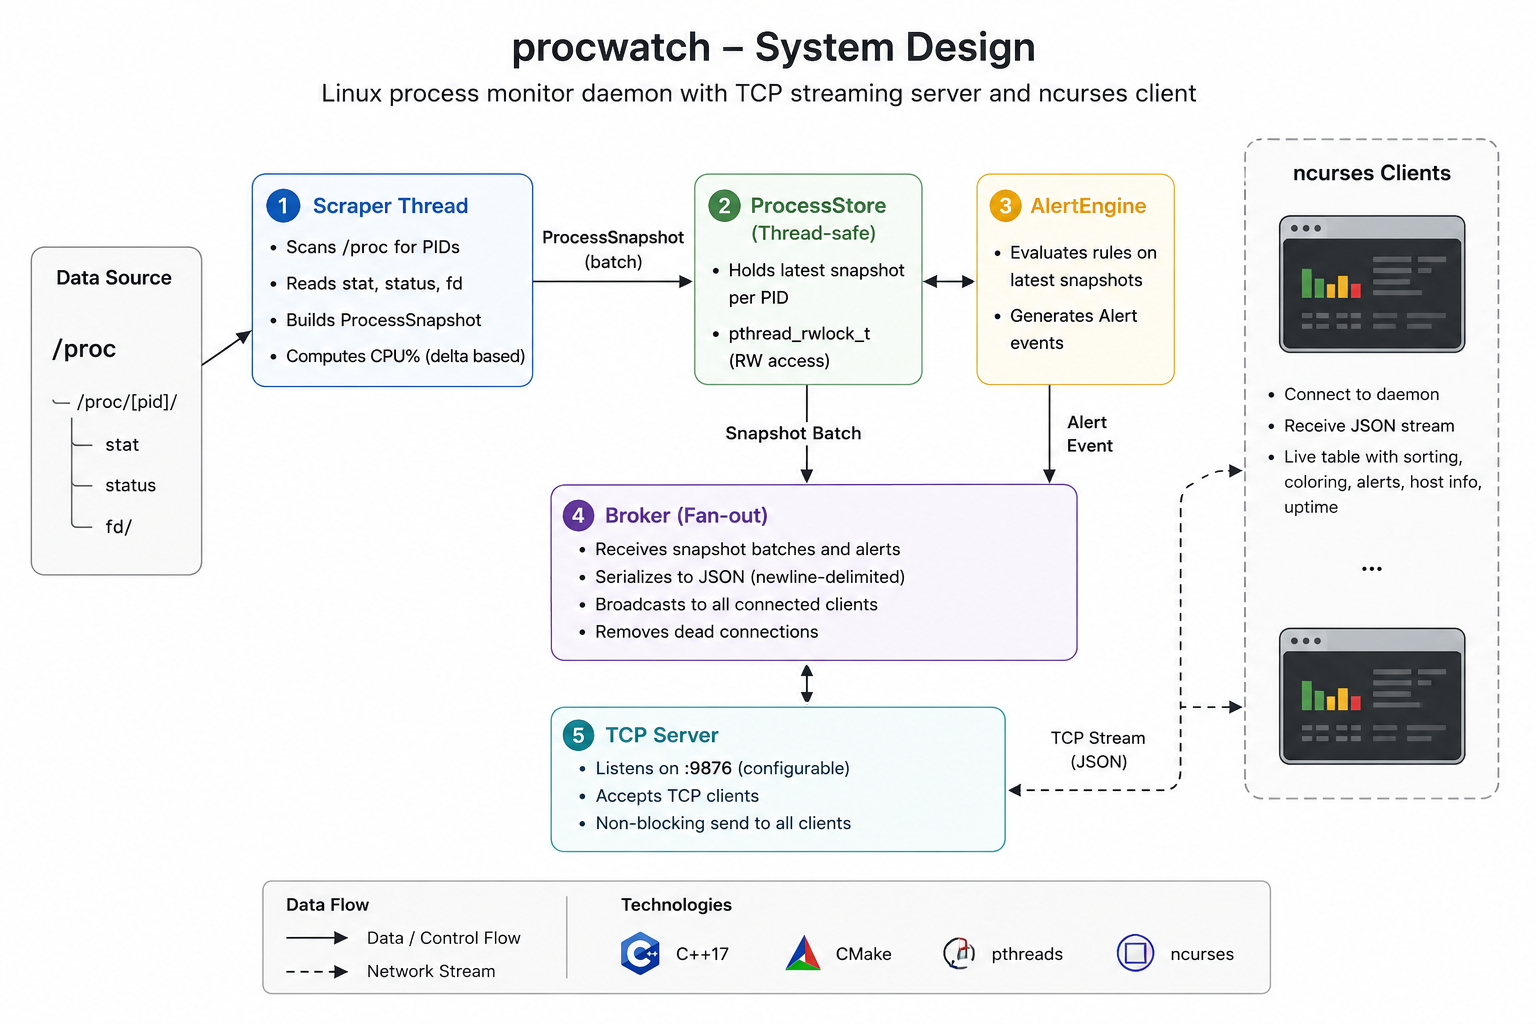
- •Scraper Thread: Enumerates numeric directories under
/proc, parses each process, and skips PIDs that vanish mid-scan. - •ProcessStore: Reader-writer-locked map of the latest snapshot per PID, allowing concurrent readers.
- •AlertEngine: Evaluates threshold rules against the store on its own interval and publishes
Alertevents. - •Broker: Receives snapshot batches and alerts, serializes them to newline-delimited JSON, and fans them out to every connected client.
- •TCPServer: Accepts clients on :9876 and pushes the JSON stream downstream.
- •Client: A separate binary that reads the stream on a dedicated pthread and renders the ncurses table.
Key Challenges
- •Computing accurate CPU percentages from raw kernel tick counters rather than a pre-computed value.
- •Handling processes that exit between listing
/procand reading their files, without corrupting a scan. - •Coordinating four long-lived threads (scraper, alert engine, broker, TCP server) around shared state with correct lock granularity.
- •Writing a correct JSON serializer — including string escaping — with no library, and streaming it in a framing format a client can parse incrementally.
- •Keeping a slow or disconnected client from stalling the broadcast path.
Key Learnings
- •The layout and semantics of the
/procfilesystem as a kernel interface. - •POSIX threading primitives:
pthread_create, mutexes, and reader-writer locks, plus RAII lock guards in C++. - •Socket programming fundamentals — partial writes,
write_allloops, broken pipes, and signal handling in a daemon. - •Designing a pub/sub fan-out layer that decouples producers from a variable number of consumers.
- •Building a responsive terminal UI with ncurses on top of an asynchronous data source.
Impact
- •Delivered a working system-monitoring stack — daemon, wire protocol, and client — in roughly 1,700 lines of dependency-free C++.
- •Demonstrated low-level systems programming across the kernel interface, threading, and network layers.